Product Salary Survey – 2026
Welcome to the 2026 Colab Product Salary Report, our second edition and an expanded view of the product market across New Zealand, Australia, and the United Kingdom.

Hey, Adam here from Colab! Welcome to our second Product Manager Salary Survey, an in-depth look at compensation benchmarks for product manager roles at all levels. Colab’s goal is to help product people and companies level up their product management, and this survey is part of our mission to support product folks with transparency on pay.
Thank you to everyone who contributed to this year’s survey. We received over 230 responses across multiple regions, allowing us to build a broader picture of compensation is evolving.
At a high level, the data suggests a relatively stable market. Salaries have not materially increased, and many of the core patterns from last year remain consistent.
However, beneath that stability, there are some early signs of change, particularly in how compensation is structured by gender, and how careers progress beyond mid-level roles.
Alongside the data, one sentiment has remained consistent across the past 12 months in our feedback: many product professionals are finding it difficult to land new roles. While some global reports, such as Lenny’s recent State of the Product Job Market, point to early signs of recovery, this has not been felt as strongly across our community. This may reflect regional differences, particularly in smaller or more constrained markets like New Zealand.
Key takeaways
- New Zealanders on average receive $44,000 less than their UK counterparts and $48,000 less than Australian.
- New Zealand Salaries are down in real terms, albeit flat nominally.
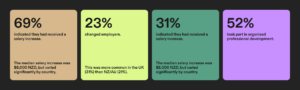
- 69% of people got a pay rise, 23% switched jobs.
- People want to move jobs, but landing a position is increasingly difficult.
- Career progression becomes non-linear after ~7–8 years.
- Gender pay appears to have widened, particularly at senior levels.
A stable market, with limited real growth
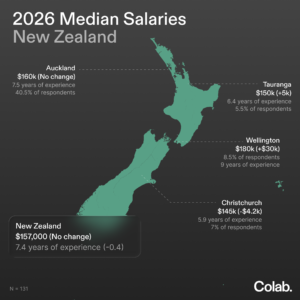
Kicking off with a deeper dive into New Zealand. The median salary for product roles has remained largely unchanged year-on-year.
- 2025 median salary: $157,500
- 2026 median salary: $155,400
On paper, this represents a relatively small change. However, when considered alongside inflation of approximately 3.1% over the same period, real earnings have declined slightly.
This suggests that the product market has seen limited growth over the past year, with some signs of tightening.
At the same time, there are signals of movement within the market. A majority of respondents (69%) reported receiving a salary increase in the past 12 months, with a median increase of approximately $8,000.
This indicates that while overall benchmarks remain stable, progression is still occurring within roles and organisations.
We have also seen a slight decrease in the proportion of respondents receiving bonuses in New Zealand, from 32% to 27%. Alongside this, the average years of experience has reduced from 8 to 7.5 years.
Individually, these changes are modest. Together, they suggest a shift in the composition of the workforce, with fewer highly experienced practitioners represented locally.
There are also indications that more experienced product talent may be exploring opportunities beyond the local market, including international roles. At the same time, the local market appears to have a higher concentration of mid-level practitioners, which may contribute to increased competition at that level.
Expanding the lens: Australia and the United Kingdom
One of the key updates in this year’s report is the inclusion of data from Australia and the United Kingdom.
Median salaries across the three markets are as follows:
- New Zealand: $157,000 NZD
- Australia: $170,000 AUD
- United Kingdom: £88,000 GBP
These figures provide a broader reference point for how product roles are compensated across different regions. At the same time, local dynamics continue to shape day-to-day opportunities and hiring conditions.
Expanding the survey in this way also reflects a shift we are seeing within the community. More product professionals are considering international opportunities or relocating, particularly as local hiring conditions remain competitive.
There are also structural differences between markets. For example, respondents in the United Kingdom were significantly more likely to receive bonuses than those in New Zealand, suggesting a stronger emphasis on performance-based compensation.
In addition, salary ranges in the United Kingdom appear more variable at similar levels of experience, indicating a wider spread depending on company, industry, or role scope. In contrast, New Zealand salaries tend to follow a more consistent progression curve.
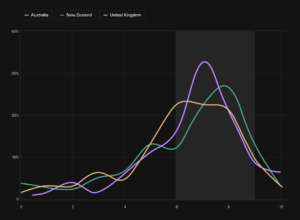
Experience remains the strongest driver of salary
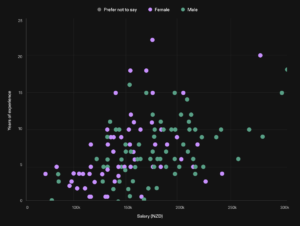
Years of experience continues to be the most reliable predictor of salary across all markets.
Entry-level salaries remain relatively high compared to national averages, with the lowest reported New Zealand salary at $70,000.
Salary progression is generally linear through the early and mid stages of a product career. However, the data suggests that this relationship becomes less consistent after approximately 7–8 years of experience.
Beyond this point, progression appears to be influenced more by scope, responsibility, and leadership than tenure alone. This is particularly evident in markets such as the United Kingdom, where there is greater variation in salaries at similar experience levels.
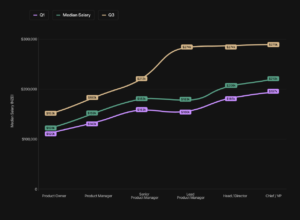
Job titles continue to influence pay, with increasing variability
Job title remains an important factor in compensation, although the relationship is not always consistent.
Median salaries (in NZD) by title show a clear upward trend:
- Product Owner: ~$128k
- Product Manager: ~$159k
- Senior Product Manager: ~$182k
- Lead Product Manager: ~$183k
- Head/Director: ~$200k
- CPO/VP: ~$210k+
At the same time, there is significant overlap between roles, particularly at mid-to-senior levels. Some titles, such as “Lead Product Manager,” show a wide salary range, reflecting differences in how organisations define scope and responsibility.
This reinforces the importance of evaluating roles based on their actual responsibilities and impact, rather than title alone.
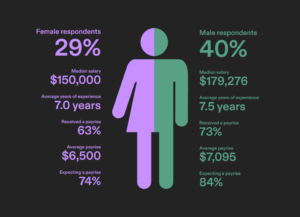
Gender pay gap: a persistent and evolving pattern
Gender continues to be an important area of focus in this year’s report.
Across all markets, male respondents reported earning approximately 19% more than female respondents, with regional variation:
- New Zealand: ~10% gap
- Australia: ~12% gap
- United Kingdom: ~23% gap
It’s important to note that this analysis is based on years of experience in product management, rather than total career experience. Many product professionals transition into product from other disciplines, meaning early “years of experience” in product may still reflect a broader and more varied career background.
The data also highlights differences in how salaries evolve over time.
At earlier stages of a product career, salaries are more variable and less aligned. Between approximately 4–8 years of experience, there is greater convergence. Beyond this point, differences begin to emerge again, particularly at more senior levels.
There are also differences in expectations around pay progression. 84% of male respondents indicated they expect to receive a pay rise in the next 12 months, compared to 74% of female respondents. This aligns with a broader pattern where males are more likely to expect, and potentially ask for salary increases.
In pursuit of understanding potential drivers of pay disparity, we asked how much parental leave respondents had taken across their careers. While this question applied to all respondents, it was particularly relevant in understanding the impact of maternity leave.
The data suggests that parental leave does have an impact on earnings in the short term. Typically, respondents take parental leave after approximately 5–6 years of experience, and initial earnings may be temporarily reduced.
However, over time, salary trajectories tend to stabilise. Respondents who took parental leave did not show materially lower long-term earnings compared to those who did not, although those who did not take leave tended to reach peak earnings earlier.
As with many factors, outcomes vary at an individual level.
Overall, the findings indicate that while progress has been made in some areas, differences remain, particularly at more senior levels.
Regional trends within New Zealand
At a regional level, salary differences within New Zealand remain relatively consistent.
- Wellington continues to show strong median salaries, despite a reduction in respondent numbers
- Auckland remains the largest market, with stable salary levels
- Christchurch shows signs of a younger workforce, with slightly lower average experience
While sample sizes vary, regional differences appear less pronounced than differences observed across international markets.
Regional insights: United Kingdom and Australia
In the United Kingdom, London continues to lead in terms of median salary, with compensation approximately 10% higher than other regions.
Other regions represented include Liverpool, Leicester, Glasgow, Edinburgh, and Cambridge, although these had smaller sample sizes. Manchester reported a median salary of £69,000 with an average of 3.75 years of experience, while Bristol showed a higher median salary of £85,000 with an average of 6 years of experience.
We expect to provide more detailed regional insights in future reports as participation increases.

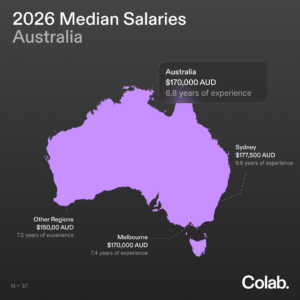
In Australia, salary data shows city-based variation, with Sydney reporting the highest median salary at $177,500 AUD, followed by Melbourne at $170,000 AUD.
Other regions included Adelaide, Brisbane, Perth, and the Sunshine Coast, although these did not have sufficient sample sizes to provide reliable median figures.
Across Australia overall:
- Minimum salary: $100,000 AUD
- Median salary: $170,000 AUD
Maximum salary: $285,000 AUD
Career movement and market sentiment
In the past 12 months:
- 23% of respondents changed employers
- 69% received a salary increase
- 52% participated in organised professional development
Looking ahead:
- 31% of respondents indicated they are planning to change employers
- Many expect continued growth in responsibility and compensation, although this may be influenced by broader market conditions
There is a noticeable gap between intent and outcome. While a significant portion of respondents are considering new roles, many continue to report difficulty securing opportunities in the current market.
This aligns with broader community sentiment, where job searches are taking longer and competition for roles appears higher. At the same time, some global indicators suggest improving conditions, pointing to potential regional differences in how the market is evolving.
Satisfaction and ways of working
Somewhat cheekily, we also asked whether these factors contributed to satisfaction at a particular employer. Across all markets, there was a relatively similar proportion of respondents who reported low satisfaction. However, the distribution between scores of 6–9 revealed some interesting differences.
In New Zealand, more respondents reported higher satisfaction levels, with fewer selecting 6 and more selecting 8 and 9. This suggests that while not universal, there are employers delivering particularly strong experiences.
In the United Kingdom, responses were more evenly distributed across 6, 7, and 8, with fewer respondents at the extremes. This indicates a broader spread of experiences, but fewer standout highs or lows.
In Australia, responses were more concentrated around 7, with fewer respondents at either end of the scale. This may suggest a more consistent, but less differentiated, employer experience.
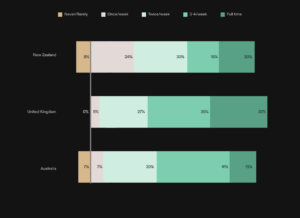
Flexibility also varied by region. Both New Zealand and Australia reported similar proportions of respondents required to work full-time in the office, while all UK respondents reported some level of flexibility.
New Zealand appeared to be the most restrictive, with 32% of respondents working from home up to one day per week. In comparison, only 5% of UK respondents reported similar limitations. Australia sat between the two, with most respondents working from home between two to four days per week.
Final reflections
The 2026 Product Salary Report presents a picture of a market that is stable, but showing some signs of change.
Salary benchmarks have remained largely unchanged, but there are shifts in workforce composition, compensation structures, and career progression patterns that are worth paying attention to.
The inclusion of international data provides a broader reference point for how product roles are compensated across markets, while local dynamics continue to shape day-to-day opportunities and hiring conditions.
As always, this report is intended to support more informed conversations—whether that’s negotiating a role, planning a career move, or building product teams.
We’ll continue to build on this work in future editions, with deeper insights and broader participation.
Thanks for reading, and once again, thanks to all that completed the survey and helped us build this insight for the product community.
Got a question? Reach out at hello@colabcohorts.com or send us a message on LinkedIn.